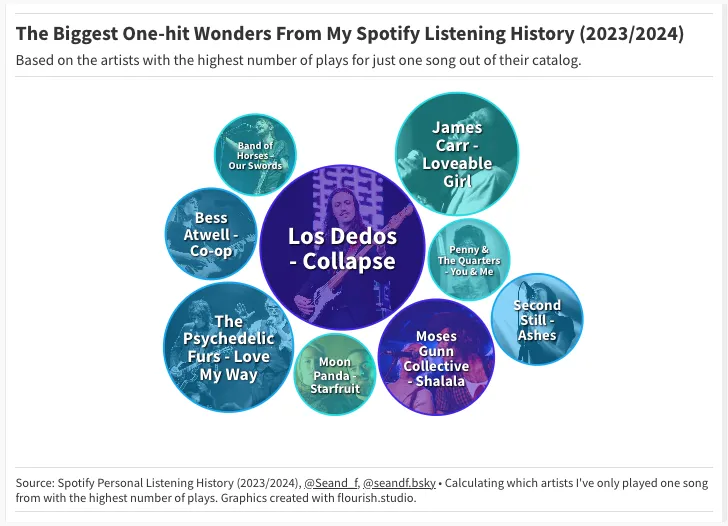
Sean FitzsimonsSpotify Unwrapped: What Else Can You Learn About Your Listening Habits?Uncovering more insights from my music listening history that Spotify Wrapped doesn’t tell you8 min read·8 hours ago--
VizzualityinVizzuality BlogIntroducing Mongabay Data Studio: Impactful Tools For Environmental ActionClosing the gap between environmental science and urgent action, through ready-to-use data viz tools that enable data journalism.4 min read·Mar 7, 2024--2
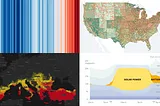
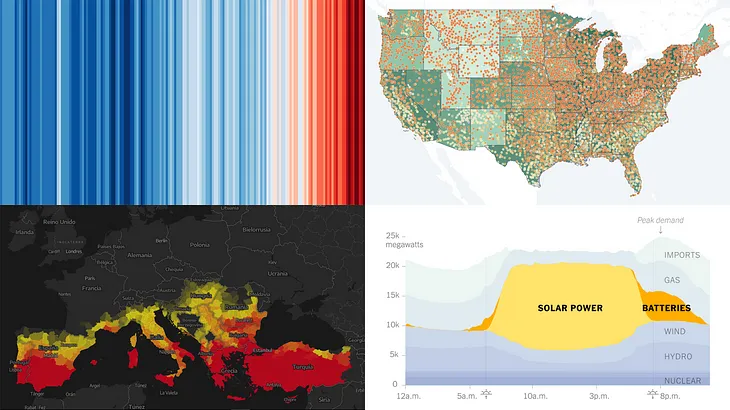
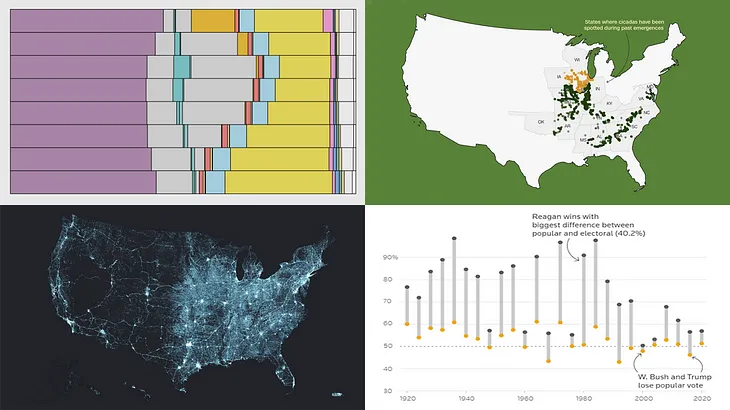
AnyChartinData Visualization WeeklyStunning New Data Visualizations Not to Miss — DataViz WeeklySee four compelling new data visualization projects that showcase the transformative power of data visualization in action.5 min read·May 17, 2024----
Younes DahamiUnderstanding Ordinary Least Squares (OLS) and Its Applications in Statistics, Machine Learning…Ordinary Least Squares (OLS) is a cornerstone method in statistics and machine learning used for estimating the parameters of a linear…8 min read·May 22, 2024----
Lee VaughaninTowards Data ScienceVisualize Endangered Animal Populations with PythonData Journalism at its best·9 min read·Feb 4, 2024----
Sean FitzsimonsSpotify Unwrapped: What Else Can You Learn About Your Listening Habits?Uncovering more insights from my music listening history that Spotify Wrapped doesn’t tell you8 min read·8 hours ago--
VizzualityinVizzuality BlogIntroducing Mongabay Data Studio: Impactful Tools For Environmental ActionClosing the gap between environmental science and urgent action, through ready-to-use data viz tools that enable data journalism.4 min read·Mar 7, 2024--2
AnyChartinData Visualization WeeklyStunning New Data Visualizations Not to Miss — DataViz WeeklySee four compelling new data visualization projects that showcase the transformative power of data visualization in action.5 min read·May 17, 2024--
Younes DahamiUnderstanding Ordinary Least Squares (OLS) and Its Applications in Statistics, Machine Learning…Ordinary Least Squares (OLS) is a cornerstone method in statistics and machine learning used for estimating the parameters of a linear…8 min read·May 22, 2024--
Lee VaughaninTowards Data ScienceVisualize Endangered Animal Populations with PythonData Journalism at its best·9 min read·Feb 4, 2024--
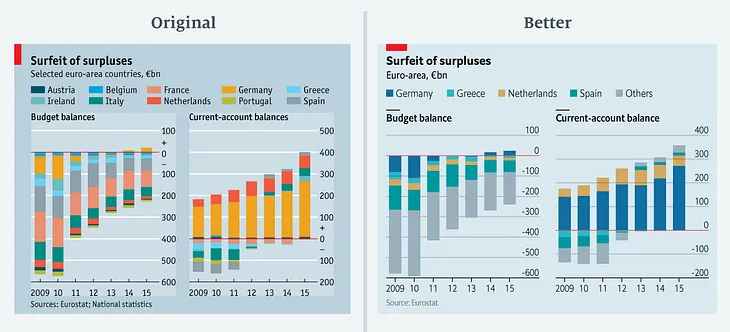
Sarah LeoinThe EconomistMistakes, we’ve drawn a fewLearning from our errors in data visualisation8 min read·Mar 27, 2019--70
AnyChartinData Visualization WeeklyNew Insightful Data Visualizations in Focus — DataViz WeeklyData visualization is a powerful tool that enhances our understanding of complex data, transforming raw figures into insights. 4 examples.4 min read·May 10, 2024--
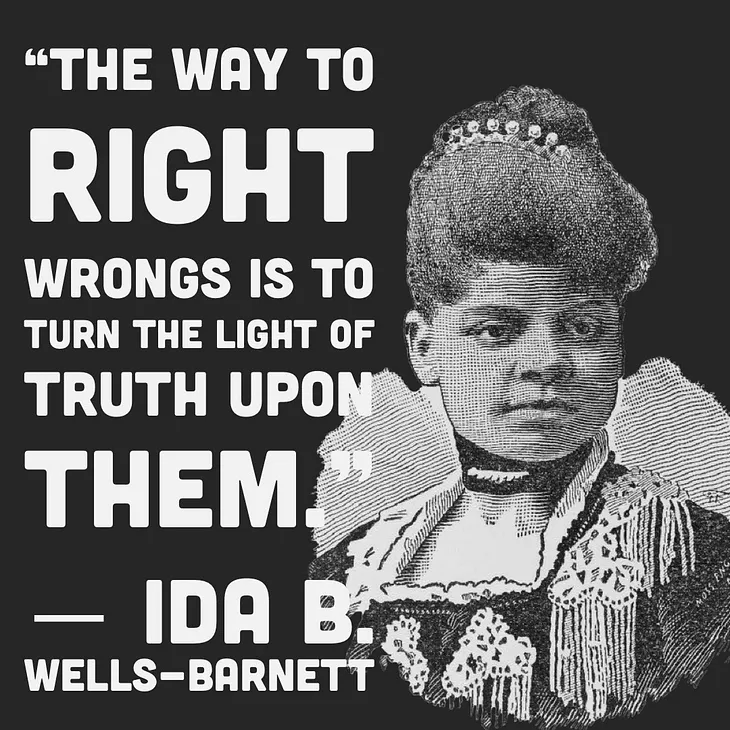
Brandeis Marshall2 Hidden Pioneers of the Data IndustryThe data storytelling and visualization contributions of Ida B. Wells-Barnett and W.E.B. DuBois·6 min read·Jul 26, 2022--3